
Once the map has been fully loaded, you can control all functions by using the collapsible sidebar at the left-hand size of the screen

The sidebar is divided into separate sections that contain grouped functions and information. These sections can be accessed by clicking on the appropriate icons. Remember that by putting your mouse over buttons, icons etc. the map shows you a tooltip with information about their functionality.
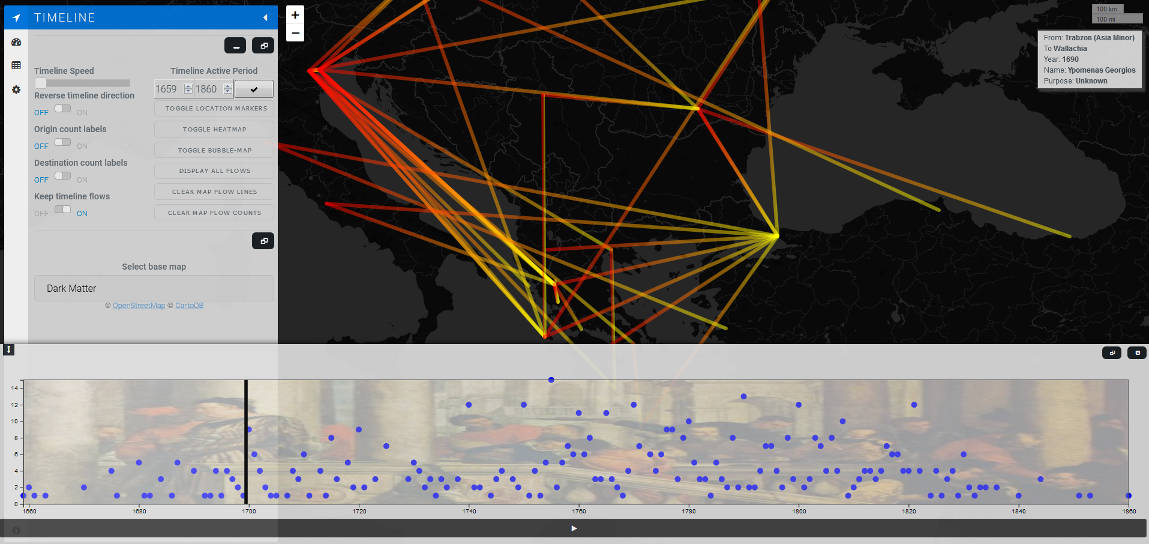
The most important section of the map is the Timeline. On top of the ‘timeline’ panel there is an actual interactive timeline that provides a visualisation of the number of travels (y-axis) through time (x-axis). This timeline can be controlled by various ways. If you mouse over the black bar near the right edge of the timeline you will notice that the vertical line becomes red. This vertical line is the year indicator and can be grabbed and moved back and forth to travel to specific years. When you move the year indicator you will see the travel flows on the map adjusting to the active year on the timeline. If you place the mouse on the edges of the area defined by the timeline you will notice that the cursor transforms to the resize icon. This allows you to interactively set the active period. The active period is distinguished by black lines which turn yellow when you mouse over as well as the higher brightness of the background image. The tools also allows you to both resize and drag the active period. You may also notice that the years in the Timeline Active Period input boxes change according to your selection and a notification box near the top right corner of the screen verifies your changes. The play/pause button allows the travel flows to be revealed as a story through time.
Each panel is divided into sub-groups separated by a horizontal line and float window and minimise buttons. The contents of these sub-groups (including the timeline) can be moved to a float window over the map or to a horizontal bar at the bottom of the screen. If desired, they can be placed back to their default position in the sidebar. All float windows are resizable and draggable. Similarly, all popup windows with extra information that can be opened by clicking on location markers, scholar names etc. can be dragged, resized or minimised. There is support for an unlimited number of opened windows, though having too many opened windows simultaneously might affect performance depending on the processing power of the client device.
The following video demonstrates some of the basic functions of the mapping tool
Below are short descriptions for each function:
| Function | Description |
|---|---|
| Play/Pause | This button plays or pauses the travel flows animation for the set active year period. |
| Timeline Speed | This sets the speed of the timeline – in terms of years- when being played. Far left position is the fastest and far right is the slowest. |
| Reverse timeline direction | This reverses the direction of the timeline when being played. If this option is enabled then the indicator will go backwards in time. |
| Origin count labels | This displays the number of visible travels originated from for each active location on the map. |
| Destination count labels | This displays the number of visible travels destined to for each location on the map. |
| Keep timeline flows | If this option is enabled the flow lines on the map are retained as the year indicator moves. |
| Timeline Active Period | This displays and sets the active period. |
| Toggle Location Markers | This displays markers for every location on the map. Clicking on these markers pops up a float window with information about the travels associated with this location. |
| Toggle Heatmap | This enables or disables a heatmap based on the total number of travels for each location. It only counts the flows for the active period and is adjustable to map zoom ins and outs. |
| Toggle Bubble-map | This enables or disables bubbles for locations based on the total number of travels for each location. It only counts the flows for the active period. |
| Display all-flows | This displays all flow lines for the active period on the map. |
| Clear map flow lines | This clears all flow lines from the map. |
| Clear map flow counts | This clears all count labels that may have been set by origin or destination count labels. |
| Select base map | This allows to change the base map to various types. |
| Function | Description |
|---|---|
| Search | Search allows to find information by typing in full or parts of text. It auto-triggers suggestions when the text is three characters or more. The results are distinguished by their types (e.g. scholars, locations, purposes etc.), and clicking on any of the results pops up a float window with additional information about the selected element. |
| Select Location | This selector allows to view information about the travels related to a location. It can be further refined using the ‘origin & destination’ selector. The travel flows have their own distinguished colour on the map which can be changed by double-clicking on the coloured box in the popup window. |
| Origin & Destination | When this is set to the default value of ‘Origin & Destination’, it will display all travels that include the selected location as origin or destination. If it set to ‘Origin’ it will only display travels that have been originated from the selected location, whereas if it is set to ‘Destination’ it will display travels have the selected location only as destination. |
| Select Scholar | This selector displays all travels for the selected Scholar. The travel flows have their own distinguished colour on the map which can be changed by double-clicking on the coloured box in the popup window. |
| Select Purpose Group | This selector displays all travels for the selected Purpose group. Purpose group is an aggregated category that includes similar purposes. The travel flows have their own distinguished colour on the map which can be changed by double-clicking on the coloured box in the popup window. |
| Show Scholar Distances | This button displays a float window with sum of travelled distances for each scholar. |
| Show Location Flows Balance | This button displays a float window with aggregated counts of travels originated from and destined to for each location. |
| Function | Description |
|---|---|
| Refresh Table | The table provides information about the flows that are currently displayed on the map. The button updates this information to match any related changes. |
| Function | Description |
|---|---|
| Language | This selector allows to switch languages of the MtE data. Currently only supports English and Greek. It does not affect the languages of the tool environment such as menus etc. |